A few weeks ago, I was trying to figure out how many states I’ve visited. “Visited” is somewhat ambiguous, so the total comes to:
- 22 if I only count states where I’ve stayed overnight.
- 24 if I count day trips, provided the state in question was the intended destination.
- 26 if I count states where I stopped to eat en route to somewhere else.
- 29 if I count that I’ve traveled through without leaving the car/train.
- 30 if I count airport layovers.
(I’m calling DC a “state” for these purposes. Leave your pedantry in the comments, which do not exist yet.)
But then I came to the most expansive definition: airspace. This is hard. If I wanted to determine which states I’ve flown over, I would have to (1) make a list of every flight I’ve ever taken, (2) dig through old emails to figure out the dates and flight numbers, (3) pay an unreasonable amount of money for a flight data API that provides at least 14 years of historical flightpaths, (4) write some code to fetch/plot them, and (5) remember to cancel the API subscription before the start of the next billing period.
I’m not going to do any of that, so why not be a physicist about it and make the (bad and wrong) assumption that every flight path is a great circle—i.e. every plane takes the shortest possible route between two airports? That would still require me to write plotting code (and dig up airport coordinates, but it turns out Mathematica has an AirportData function for some reason), So I wondered: is there a map projection that turns great circles into straight lines? If so, I would be able to draw “flight paths” on the map and look to see which states they pass over.
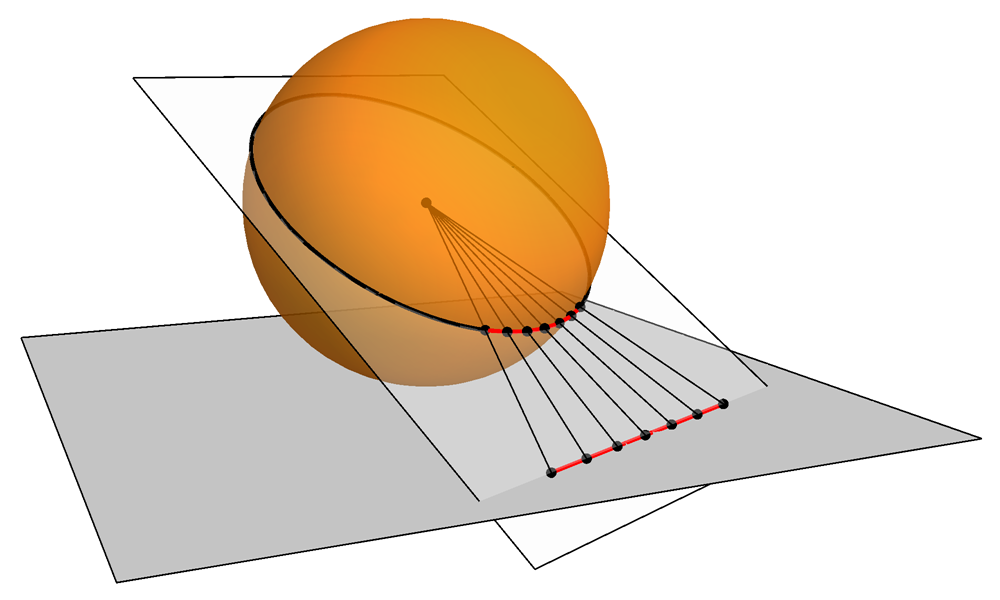
Turns out there is! It’s called the gnomonic projection, and you can obtain it by projecting the globe onto a nearby plane, as if there were a light at its center. It’s also, conveniently, already implemented in Mathematica (stop reading my mind stephen).
Assembling the plot took three lines of code, including the list of flights:
toEdge[x_] := Entity["Airport", x[[1]]]
  \[UndirectedEdge] Entity["Airport", x[[2]]];
tripList = {{"ABQ", "DEN"}, {"ABQ", "SAN"}, {"ATL", "BOI"}, ... };
GeoGraphPlot[toEdge/@tripList, GeoProjection -> "Gnomonic",
  GraphLayout -> "StraightLine", ImageSize -> Large]
The output:
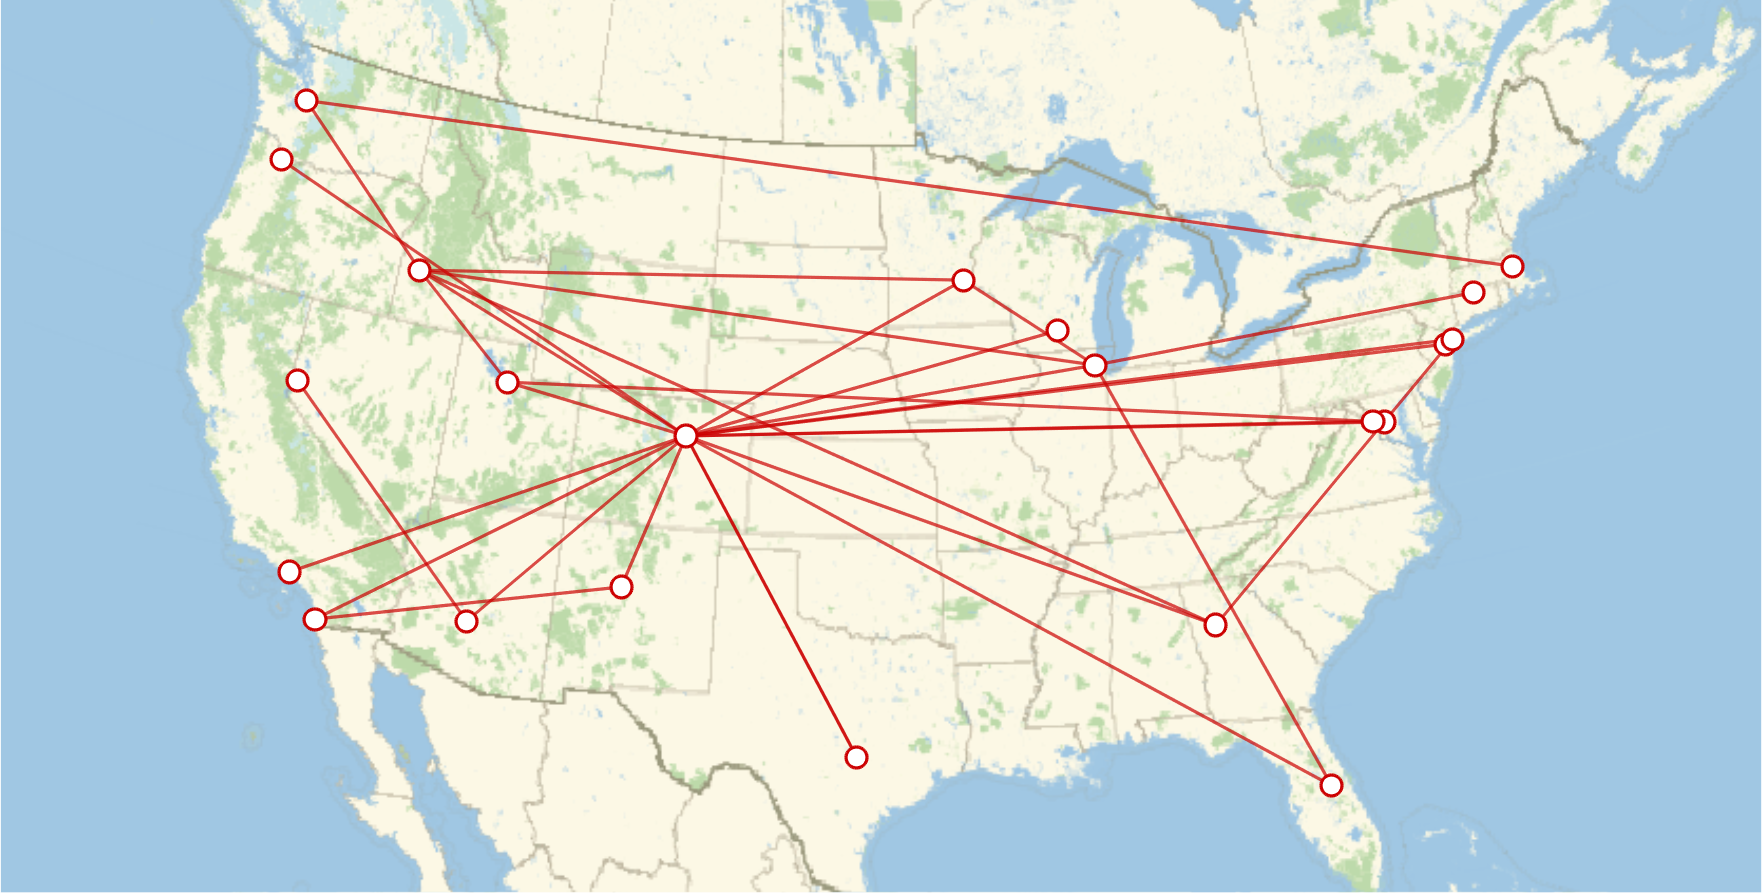
Turns out I’ve “been to” every state except Alaska, Hawaii, Louisiana, and Maine. Cool! Though Michigan and South Carolina are admittedly kind of marginal.
…It was at this point that I discovered that GeoGraphPlot takes a GraphLayout -> "Geodesic" option, so I could’ve done this with curved flightpaths the whole time.