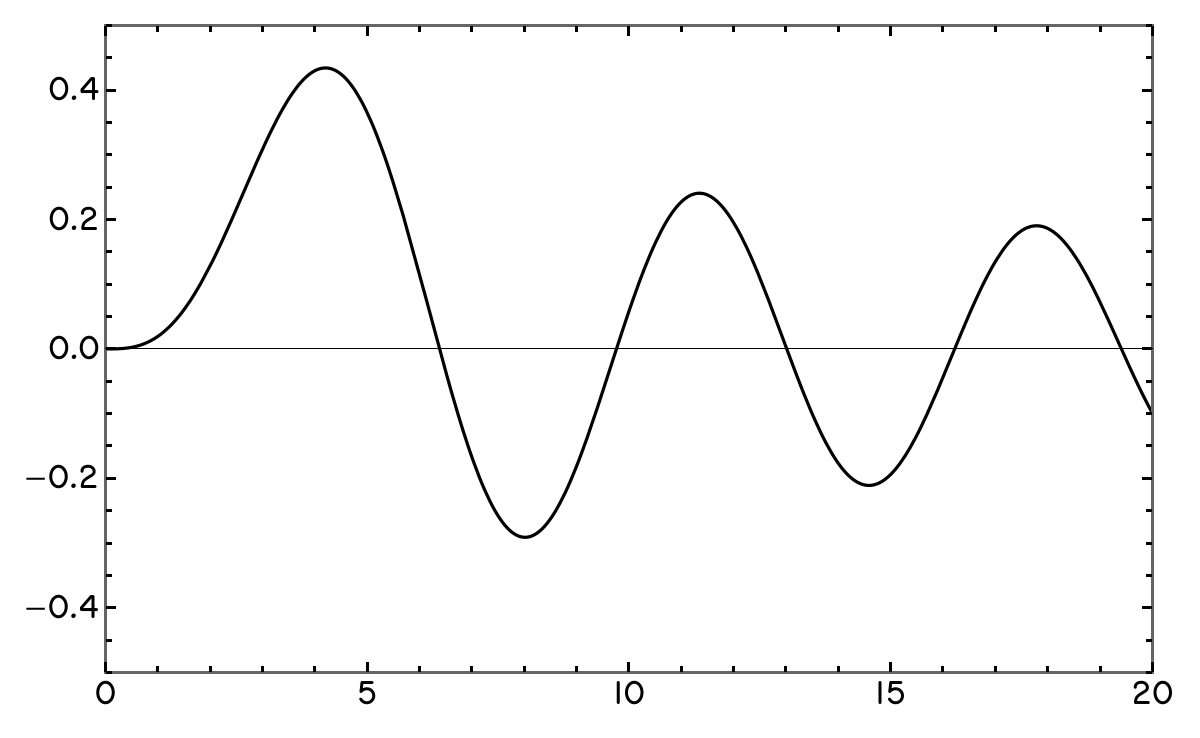
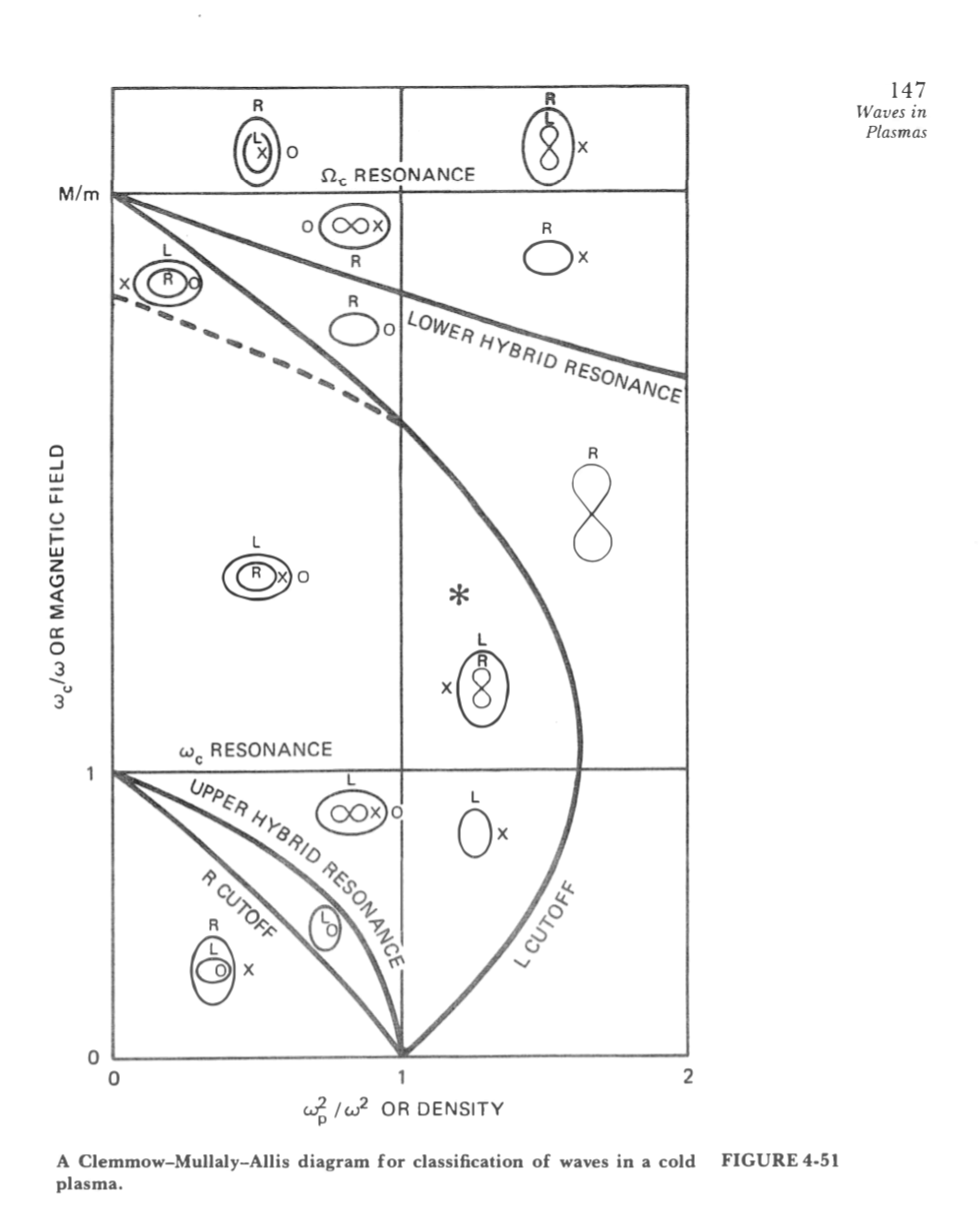
I’ve always had a soft spot for the graphs and diagrams found in Cold-War-era technical literature: chunky tick marks, thick black lines drawn with French curves, stencil letters with their telltale rounded tips and constant stroke weight. A few months ago, I set out to recreate this style in Mathematica, and I’ve been quite pleased with the result.
The code below creates a new theme called “1974”, based on Mathematica’s built-in “Monochrome” theme, which you can then pass to plotting functions via the PlotTheme option. This theme requires installing the Routed Gothic typeface.
It’s named for the publication year of Francis F. Chen’s Introduction to Plasma Physics, a book with many wonderful examples of these graphics:
Code:
Link to the full example notebook.
Mathematica’s internal plotting functions aren’t publicly documented, but thanks to the work of StackExchange sleuths, some Claude prompting, and careful chaining of ClearAttribute and Definition, I’ve figured out a reasonably robust method to define my own themes:
ClearAll[AddDerivedTheme];
(* Creates a new PlotTheme based on an existing one *)
(* getCustomOpts should take in a string (the name of a plotting function) and return a list of rules *)
AddDerivedTheme[newTheme_String, baseTheme_String, getCustomOpts_] :=
    Module[{att},
        att = Attributes[Charting`ResolvePlotTheme];
        ClearAttributes[Charting`ResolvePlotTheme, att];
        Charting`ResolvePlotTheme[newTheme, f_] :=
            Module[{baseRules, overrides},
                overrides = Flatten[getCustomOpts[f]];
                baseRules = Charting`ResolvePlotTheme[baseTheme, f];
                Join[overrides, DeleteCases[baseRules, Rule[Alternatives @@ Keys[overrides], _]]]
            ];
        SetAttributes[Charting`ResolvePlotTheme, att];
    ];
(This has been tested in Mathematica 15.0.11 and will probably work in v14 as well. Some older Mathematica versions might require you to replace Charting`ResolvePlotTheme with the lower-level function System`PlotThemeDump`resolvePlotTheme—note that the lowercase r is not a typo).
Defining theme rules for “1974”:
AddDerivedTheme[
    "1974",
    "Monochrome",
    p |-> {
        (* same options for all plots, but you can break this up if you want
           different opts for different top-level plotting functions. *)
        BaseStyle  -> Directive[FontFamily -> "Routed Gothic", Black, FontSize -> 14],
        LabelStyle -> Directive[FontFamily -> "Routed Gothic", Black],
        TicksStyle -> Directive[FontSize -> 16],
        FrameStyle -> Directive[FontSize -> 16, AbsoluteThickness[1.5]],
        Frame -> True,
        PlotRangePadding -> None
    }
];

(* Mathematica's plotting infrastructure makes it hard to style legends in theme
   definitions. I got around this by defining a helper function that I can pass
   to LineLegend via the LegendFunction option. *)
LegendPostscript["1974"] := Framed[#,
    RoundingRadius -> 0,
    FrameMargins -> 0,
    BaseStyle -> Directive[FontSize -> 14, FontFamily -> "Routed Gothic"]
]&;
The new theme in action:2
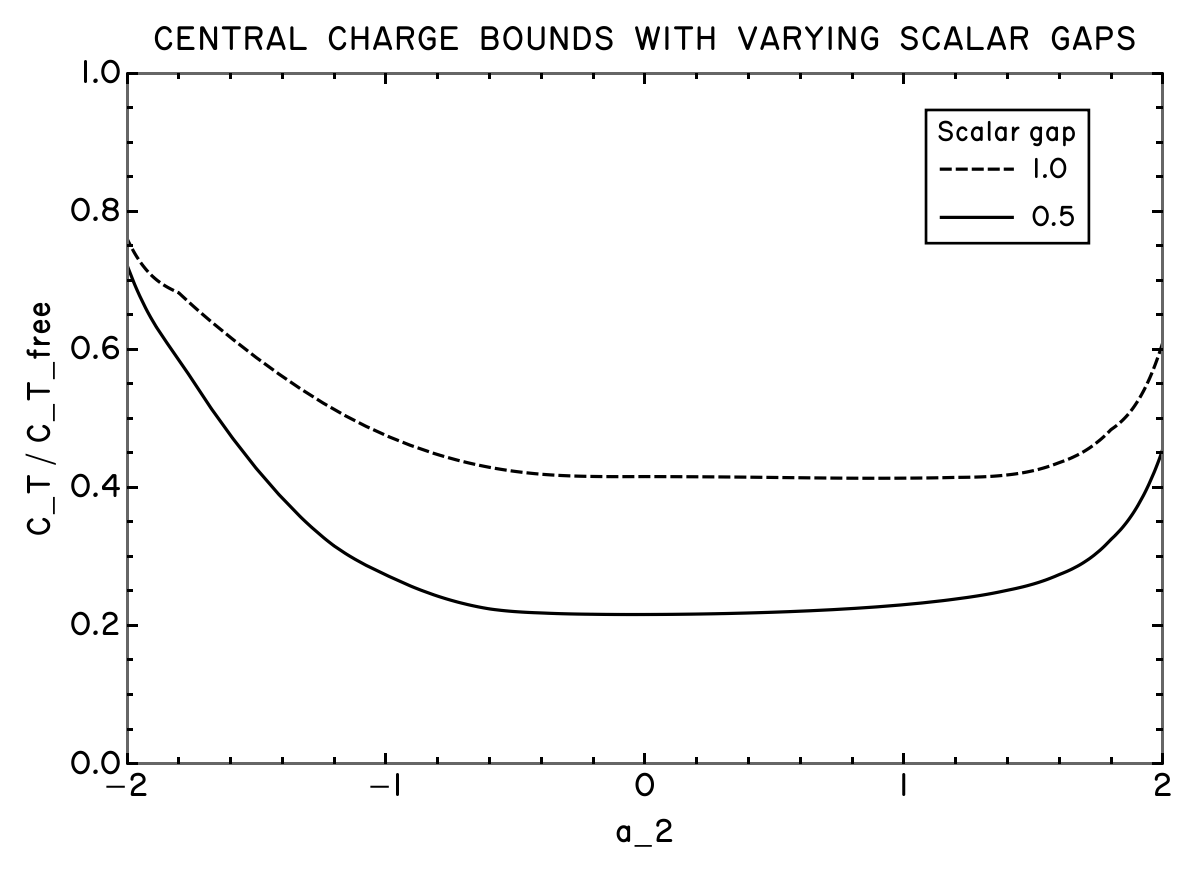
(* Graph at the top of this page: *)
Plot[BesselJ[3, x], {x, 0, 20}, PlotTheme -> "1974", PlotRange -> {-1/2, 1/2}, ImageSize -> Large]

(* A more detailed example: *)
Plot[
    {Interpolation[testData1][x], Interpolation[testData2][x]},
    {x, -2.1, 2.1},
    PlotRange -> {{-2, 2}, {0, 1}},
    AspectRatio -> 2/3,
    PlotLabel -> "CENTRAL  CHARGE  BOUNDS  WITH  VARYING  SCALAR  GAPS",
    FrameLabel -> {"a_2", "C_T / C_T_free"},
    PlotTheme -> "1974",
    Axes -> None,
    PlotLegends -> Placed[
        LineLegend[
            {"0.5", "1.0"},
            LegendLabel -> "Scalar gap",
            LegendLayout -> "ReversedColumn",
            LegendFunction -> LegendPostscript["1974"]
        ],
        {{0.85, 0.85}, {0.5, 0.5}}
    ],
    ImageSize -> Large
]
-
Technically “Wolfram Notebook 15.0.1,” or whatever it’s called now. ↩︎
-
The data for the last plot comes from an attempt to reproduce some of the bounds in https://arxiv.org/abs/1705.04278. It’s from an old and buggy version of my code, so please avoid inferring anything from it. ↩︎
As you’ve probably heard by now, Harvard has declined to comply with Trump’s latest threat (articles in the New York Times1 and the Chronicle of Higher Ed). Reading their response, I am certain of two things—first, that this is a positive development which reflects well on Harvard’s leadership. And second, that it never could’ve happened without an unforced error on the part of Trump administration.
Some context for those of you outside academia: In the US, most major American universities get between 10 and 50 percent2 of their operating income from research grants, almost all of which come from the federal government. These grants pay for the direct costs borne by individual labs (research staff, equipment, travel), as well as a host of indirect costs (clerical staff, maintenance workers, machine shops, libraries, etc.).3 Like all federal grants, these come with compliance requirements, which include nondiscrimination with regard to sex (Title IX) and race (Title VI). The Trump administration has sought to deploy these requirements in bad faith (and without due process) in order to steal from institutions they perceive as opposing them.
And it might very well have worked! Remember, colleges do not support scientific research out of the goodness of their hearts—they do it because it makes them money, and they terrified of losing that revenue stream. From their perspective, what’s the harm? Expel some students? Sure, those kids were annoying anyway, and there’s no shortage of people willing to take their place (it’s Harvard). Get rid of Ethnic Studies? Why not! Most of the classes can be taught by History or English or Sociology profs, and it’s not like they brought in that many grants. No more diversity policies in faculty hiring? Eh, that was already on its way out. The only price is your dignity!
This, I imagine, was Columbia’s logic when they agreed to cooperate with the Trump administration last month.
Harvard was facing the same calculus, and it’s not as if they’ve previously shown any reticence toward playing ball with Republicans. Remember the Claudine Gay testimony that eventually led to her resignation? It was not compelled. She testified voluntarily! Harvard was so worried about jeopardizing its funding that it sent its own president into the jaws of the US House of Representatives, and then, when it became clear the news cycle wouldn’t die, forced her to resign.
So what changed?
Well, after Columbia expelled protestors, cooperated with ICE, placed its Middle Eastern Studies Department in academic receivership, fired its president, and made every effort to negotiate with the Trump administration in good faith, the NIH went ahead and froze all their grants anyway.
Columbia, you see, made a deal with the devil. These agreements have many disadvantages: damnation, hellfire, forfeiture of your immortal soul, the knowledge that you’re not actually the best fiddle player there’s every been, and so on. But there’s a much bigger problem that rarely gets brought up. Namely, the devil is not a reliable counterparty. He can’t be trusted to hold up his end of the bargain, and you have no way of compelling him to.
So when Trump shows you that the cost of cooperating with him is the same as the cost of telling him to fuck off, you might as well pick the one that doesn’t involve eating shit.
A brief digression: I have some experience winning major policy changes from Ivy League schools. My union negotiated a CBA with our university a couple years ago, and while I wasn’t sitting at the bargaining table myself, I was one of the most involved organizers. Being a good counterparty is everything. Management needs to know that, when they give you the contract language you want, the thousands of workers screaming at them will immediately de-escalate, go back to their jobs, and vote to ratify. If you can convincingly signal this, you can win so. goddamn. much. It brings me a lot of pleasure to know that our bargaining committee are better negotiators than the guy who named his book The Art of the Deal.
Back to Columbia. Do you want to know what the saddest part is? This should’ve been obvious to them, too. To describe Trump’s campaign rhetoric as “empty promises” would be too kind—most of his promises actively contradicted each other. His businesses regularly stiffed contractors and got away with it. This is just who he is.
Under ordinary circumstances, it would’ve rendered him radioactive. Every social or political norm is a lesson learned through bitter experience. You keep your commitments, because if you don’t, no one will make positive-sum deals with you. You abide by the results of elections, because if you don’t, you deligitimize the government, and your life is rendered solitary, poor, nasty, brutish, and short.
But norms require enforcement, and after 70-plus years of relative stability, we had forgotten how to hold people to account.4 All the Democrats could manage was a sort of cargo cult moralism, an attempt to model a society with standards of behavior in the hopes we might return to it. At best, this was “leading by example.” At worst, it was the Biden administration slow-walking the Trump prosecutions, because they seemed like the sort of thing a less stable country might do.
When you try this in an iterated prisoners dilemma, you lose the moment your opponent realizes he can defect without retaliation.
I think it’s clear that, if Trump were a Machiavellian genius and not just an old crank with a zero-sum way of thinking, he could consolidate power far more effectively. The knowledge of how vulnerable our country would be to a competent authoritarian keeps me up at night. But this prospect is incompatible with what he is and why he was able to get elected in the first place: Trump is the product of a society that has forgotten why it cared about honesty.
And that means there’s a way out. What we have forgotten, we can learn again. Remember that, when someone in your organization wants to cut a deal with his administration, when a Democratic strategist suggests making a small concession on gender-affirming care because “it’s not like it impacts that many people,” you are walking into a trap. And try, with all your might, to have at least as much backbone as the upper management of Harvard University.
It’s not hard. The bar is pretty low.
-
As I’m writing this, the Harvard piece is the lead story on the NYT website, while Trump defying a court order to return Kilmar Abrego Garcia has been relegated to off-lead—which should tell you something about the paper’s priorities. ↩︎
-
With plenty of outliers on the high end due to FFRDCs and UARCs. Caltech’s revenue, for instance, is 88% grants because JPL has a larger budget than the rest of the university combined (though the rest still gets 54% of its income from grants, because Caltech). ↩︎
-
While there’s an argument to be made that the overhead universities take for indirect costs is on the high side, the Trump administration’s attempts to cap them at 15% is fucking nuts. I’m not going to get into it here, but I’ll link you to some good explainers from Derek Lowe at In the Pipeline and Douglas Natelson at nanoscale views. ↩︎
-
I never thought I’d become a “good times create weak men” guy, but time makes fools of us all. Presumably weak ones. ↩︎
Below are several questions which I would like answers to. They range from well-studied (but not by me), to knowable-in-due-time, to perhaps intrinsically unknowable.
–
How much did GOTV shift margins in swing states?
Which demographics swung toward Trump? Why?
Relative to the pre-pandemic years, real wages are up, and the gains have been concentrated in the bottom half of the income distribution. So at least one of the following must be true of swing voters:
-
They don’t care about their own material conditions, and the shift from 2020 was due to a newfound embrace of Trump’s culture war rhetoric.
-
They care about their material conditions as interpreted through media (and social media) narratives, which are very bad right now (this is the Will Stancil thesis).
-
They care about inflation much more than unemployment, perhaps because they’re anchored to lower prices, or they attribute inflation to systemic factors while attributing “can I get a job?” to personal ones. If this is true, it may explain why every incumbent party is recieving the same treatment.
-
They’re specifically mad about the cost of housing, which has risen relative to wages in many markets.
-
They’re mad about the end of pandemic-era direct cash benefits, and don’t realize that Biden tried to extend them.
-
They hate tradeoffs, and any incumbent which has to make them will get blamed (this may be true now but it sure as hell wasn’t during the Obama years).
-
They’re mostly affluent, and are relatively less well-off due to decreasing income inequality (I’m almost certain this one is wrong, but I’ll wait for more data).
Which one is it? And how can we find out?
Was the Harris campaign doomed from the start?
Can the right-wing radicalization machine be stopped? Can it be stopped without aggressive action by a government we don’t control?
Why don’t scandals matter anymore?
How do we force voters into better information environments? How do we avoid amplifying their worst impulses?
How do we build social instutions that are robust to a second Trump?
If emissions remain at current levels, or are cut too slowly, what are the most likely impacts of climate change? What are the long-tail scenarios? Which areas will remain (become?) pleasant, which will remain “habitable” but only just, and which will be destroyed?
What climate feedback loops are most worth worrying about?
How ideologically committed will the Trump administration be to mass deportation? What about making life harder for trans people? What about banning abortion?
If Republicans lose the 2028 election, will they concede defeat?
How does democratic backsliding usually proceed? How can it be stopped?
Which countries have succeeded in reversing it, and how far along were they?
What will happen next?
What is required of us?
A few weeks ago, I was trying to figure out how many states I’ve visited. “Visited” is somewhat ambiguous, so the total comes to:
- 22 if I only count states where I’ve stayed overnight.
- 24 if I count day trips, provided the state in question was the intended destination.
- 26 if I count states where I stopped to eat en route to somewhere else.
- 29 if I count that I’ve traveled through without leaving the car/train.
- 30 if I count airport layovers.
(I’m calling DC a “state” for these purposes. Leave your pedantry in the comments, which do not exist yet.)
But then I came to the most expansive definition: airspace. This is hard. If I wanted to determine which states I’ve flown over, I would have to (1) make a list of every flight I’ve ever taken, (2) dig through old emails to figure out the dates and flight numbers, (3) pay an unreasonable amount of money for a flight data API that provides at least 14 years of historical flightpaths, (4) write some code to fetch/plot them, and (5) remember to cancel the API subscription before the start of the next billing period.
I’m not going to do any of that, so why not be a physicist about it and make the (bad and wrong) assumption that every flight path is a great circle—i.e. every plane takes the shortest possible route between two airports? That would still require me to write plotting code (and dig up airport coordinates, but it turns out Mathematica has an AirportData function for some reason), So I wondered: is there a map projection that turns great circles into straight lines? If so, I would be able to draw “flight paths” on the map and look to see which states they pass over.
Turns out there is! It’s called the gnomonic projection, and you can obtain it by projecting the globe onto a nearby plane, as if there were a light at its center. It’s also, conveniently, already implemented in Mathematica (stop reading my mind stephen).

Assembling the plot took three lines of code, including the list of flights:
toEdge[x_] := Entity["Airport", x[[1]]]
  \[UndirectedEdge] Entity["Airport", x[[2]]];
tripList = {{"ABQ", "DEN"}, {"ABQ", "SAN"}, {"ATL", "BOI"}, ... };
GeoGraphPlot[toEdge/@tripList, GeoProjection -> "Gnomonic",
  GraphLayout -> "StraightLine", ImageSize -> Large]
The output:
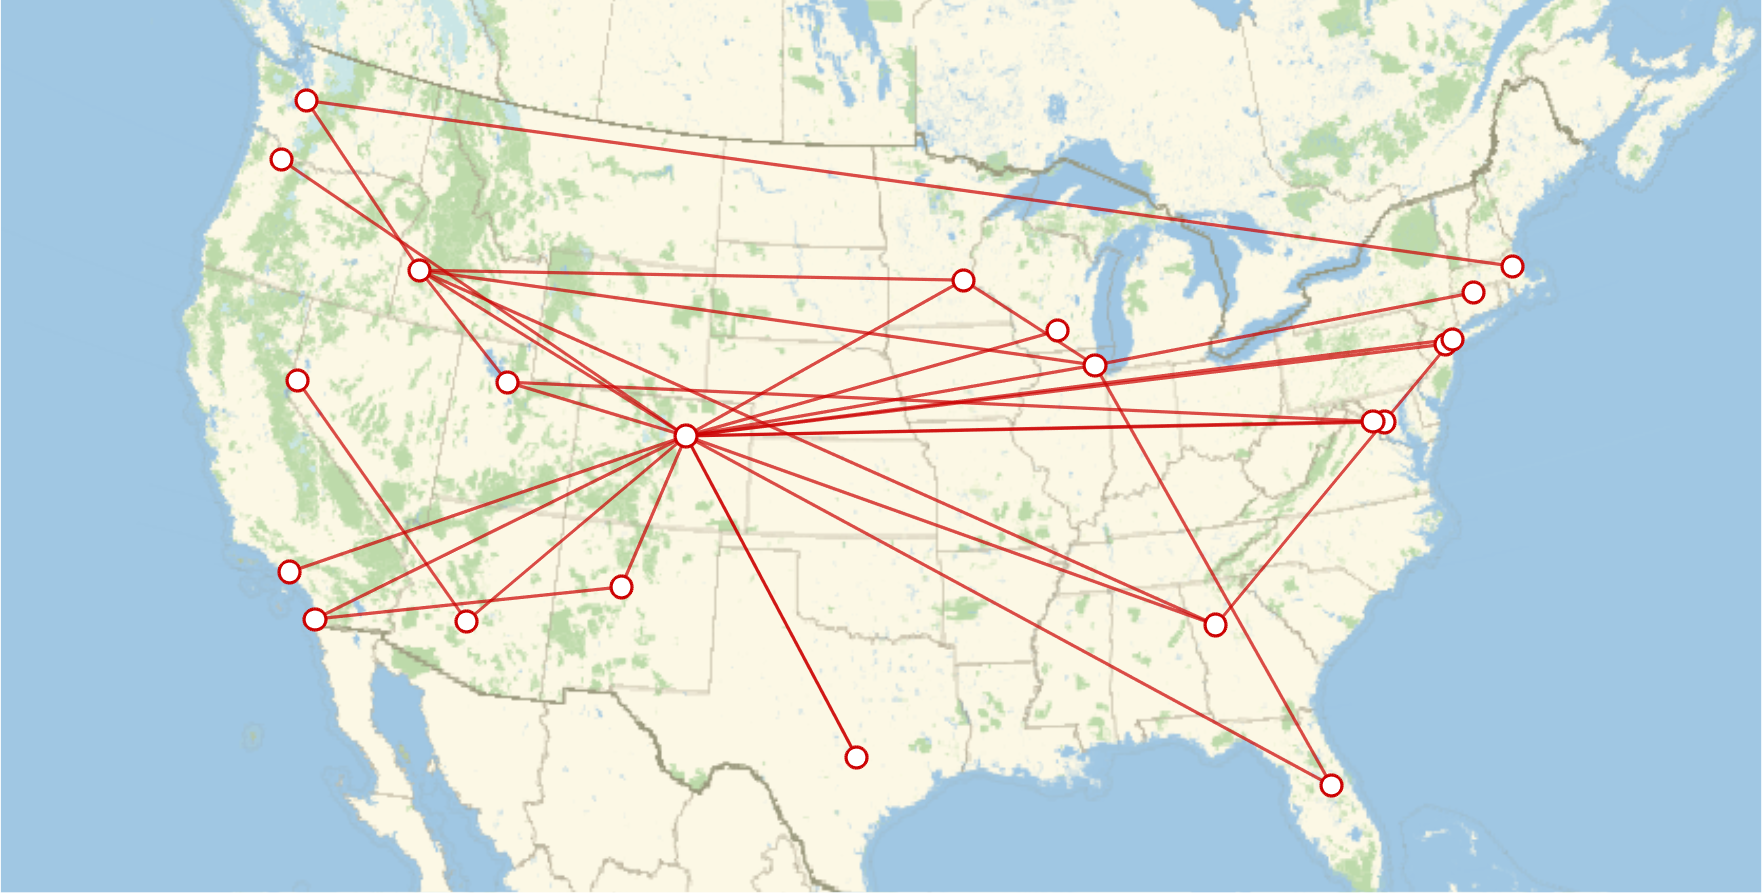
Turns out I’ve “been to” every state except Alaska, Hawaii, Louisiana, and Maine. Cool! Though Michigan and South Carolina are admittedly kind of marginal.
…It was at this point that I discovered that GeoGraphPlot takes a GraphLayout -> "Geodesic" option, so I could’ve done this with curved flightpaths the whole time.
All forecasts are listed with probabilities.
-
98%: The Democratic nominee will be Kamala Harris. Anyone who could mount a serious challenge to Harris has already endorsed her. She has a massive fundraising advantage. No one has any incentive to run against her, and the only people pushing for a floor fight right now are the political reporters who want to cover it.1
-
100%: The Republican nominee will be Donald Trump. Duh.
-
75%: Democrats will win the electoral college. Democratic over-performances in 2022 are widely attributed to two things: the Dobbs effect, and the fact that Republicans stood by Donald Trump after he led an insurrection. Kamala Harris is well-positioned to take advantage of both these things. Her only weakness is her polling numbers, and frankly, I do not believe the crosstabs we’ve been seeing.
Anything can happen before November, of course, which is why this is only at 75%.
-
80%: Harris’s running mate will be a white guy. Remember how nervous the Obama campaign was about racist backlash?
-
55%: Harris’s running mate will be Josh Shapiro or Mark Kelly. Obvious reasons. I’d imagine Kelly to be slightly favored, since he pisses off fewer members of the Democratic coalition.
-
5%: Harris’s running mate will be Andy Beshear. Beshear’s electoral success, while impressive, is at least partly attributable to a family brand which does not exist outside of Kentucky.
-
0%: Harris’s running mate will be Gavin Newsom. Read the 12th Amendment, you morons.
-
60%: JD Vance will get outed as a commenter on, or frequent reader of, at least one blog that endorses scientific racism.2 This stuff is quite popular in the circles Vance runs in, and he’s in enough fucked up groupchats that we can probably find receipts.
-
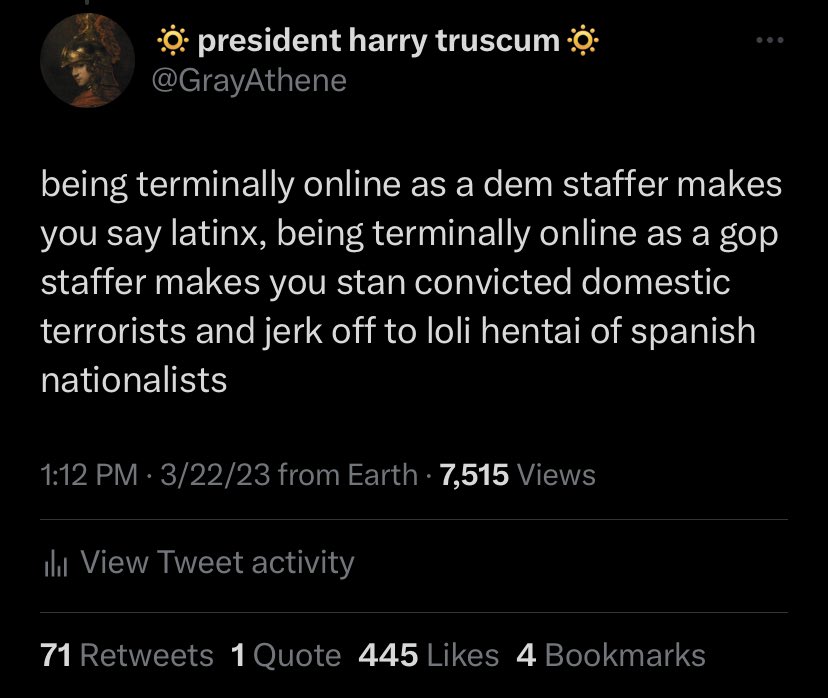
85%: At least one ad will get pulled by a network for being too bigoted. Have you seen the kind of people who staff Republican campaigns these days? They’re incapable of running against a black woman and being normal about it. Or, put another way:
-
80%: Relative to 2020, the Democratic share of the youth vote (ages 18-29) will not decrease by more than 5 percentage points.3 Polling crosstabs, if taken at face value, suggest unprecedented age and race depolarization. Isn’t it more likely that young voters just don’t pick up their phones very much, and the ones who do are kind of weird? The Lizardman problem is also going to be compounded for subgroups with low response rates.
-
80%: Relative to 2020, the Democratic share of the black vote will not decrease by more than 5 percentage points. See above. Young black voters are less solidly Democratic than older ones, but not by a large enough margin to cause the depolarization we’re seeing.
-
I have no idea what’s going to happen to the Hispanic vote.
-
75%: Democrats will outperform the 538 forecast in Nevada. “Ground game” is usually overrated, but Nevada Democrats have one of the best turnout operations in the country, while Nevada Republicans have one of the worst.
Let’s see how I do!
-
Also some donors, but I think they’ve mostly been pacified. ↩︎
-
I’m defining “scientific racism” as the belief that (1) cognitive ability differs across racial groups, (2) this difference is mostly genetic, and (3) these facts should be the basis for policy. For the purposes of my forecast, the website in question has to be very open about it. Unz, Takimag, HBD Chick, and Richard Hanania all count. Quillette does not, nor do mainstream Substack guys who make vague noises in the race-and-IQ direction. ↩︎
-
This can be tricky to measure. I’ll default to Pew’s validated voter survey unless there’s a consensus that another source has better methodology. ↩︎